XGLOBAL Markets
Trendlines
You can browse our resources to guide you through so you can gain the requisite knowledge for successful trading. First, you can read the course, which is free and self-explanatory. It does not require any further references in order to understand the concept at your own pace and the key ingredients behind trading in the largest financial market.
The basic trendline is probably one of the simplest and the most valuable of technical analytic tool. Many traders tend to ignore using this specific indicator to analyse the market just because they do not have useful information on how to draw a trendline. If marked appropriately and drawn with caution, trendlines could provide actionable insights on making trading decisions.
Steepness of the Trendline
The most important trendlines tend to approximate an average slope of 45 degrees. A 45 degree line reflects the situation where the prices are advancing or declining at such a rate where the prices and the time are in a perfect balance. If a trendline is too steep, then this indicates that prices are advancing too rapidly and that the current steep ascent will not be sustained. When steeper trendlines occur, it is best to resort to additional tools such as a moving average.
An Uptrend
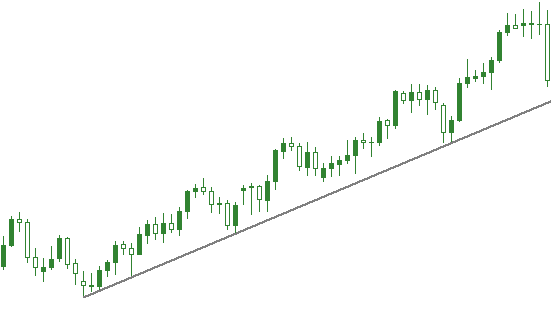
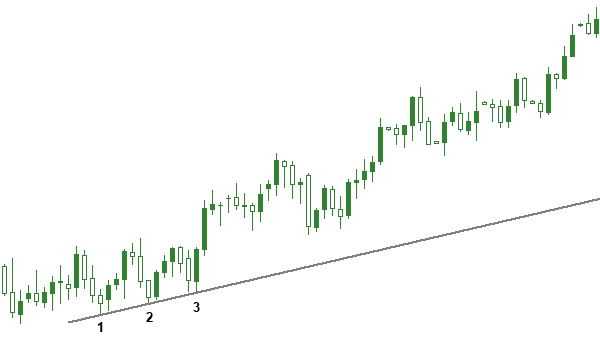
The uptrend line is a straight line drawn upward to the right along identifiable support areas. It is drawn like a positive slope where at least there must be two reaction lows where the second low is higher than the first one. Once two ascending lows have been identified, you can then draw a straight line that connects the lows and projects up and to the right.

In an uptrend, the corrective dip will often touch to the uptrend line. Now the intention of each trader is to buy at dips in an uptrend. The trendline can be considered as a support boundary of the market and it can be used as a buying area. When acting as a support, it signifies that there is an increase in demand as the price rises and as far that prices stay above the uptrend line, the buyers’ demand rises and bullish signal is in action. On the other hand if a break occurs below the trendline, then a ‘change of direction’ is about to occur with demand decreasing.
A Downtrend
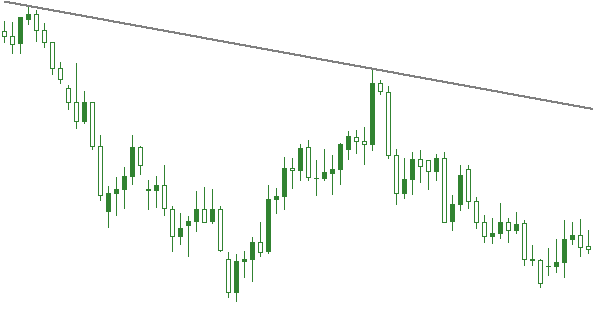
A downtrend is drawn downward to the right along with successive resistance peaks. It represents a negative slope by having the second high lower than the first high. For the downtrend to be intact, the line needs to be touched a third time with prices bouncing off it.
When acting as a resistance, it shows an increase in supply which is an indication of bearish signal. What happens is that as long as the price remains below the downtrend, then it is in order. However if a break occurs above the downtrend, then it is a sign of imminent change.

Sideways Trend
The last but not the least on the types of trend is the sideways which, although not so popular, indicates that prices fluctuate within a narrow range – meaning that the currency pair under study neither appreciates nor depreciates. A sideways may mean a horizontal trend which may represent a consolidation period when the forces of supply nearly equals demand.

Validating A Trendline
There is a general assumption that to validate a trendline, the line drawn need to be touched a third time with prices bouncing off of it. It is up to the technical analyst to see if the chart is at first trendline worthy and the possibility of joining two points with the valid point in constructing it. When a chart is validated, it boosts trade confidence in deciphering the true market movement.

How to Determine the Significance of a Trendline
The length of the time a trend exists, the number of times being tested and the slope of the trend as we have discussed before have great importance of trendlines. For example, a trendline that has been successfully tested ten times and that has continuously demonstrated its validity is a more significant trendline that has been touched three times. In addition, a trendline that is in effect for nine months is of more importance than one that has been in effect for nine days.
Fan Principle
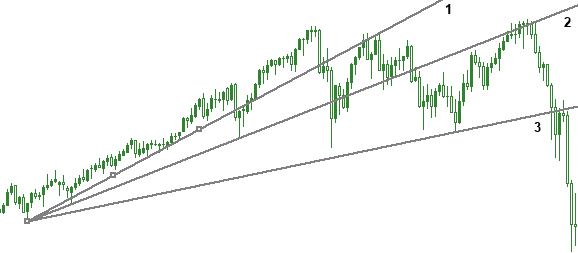
Sometimes, after the violation of an up trendline priced will decline a bit before rallying back to the bottom of the previous up trendline which now is considered as a resistance line.

The figure above, shows how prices rallied but failed to penetrate line one (1). The second trendline (2) can now be drawn which is also broken. After another failed rally attempt, a third line is drawn (3). The breaking of the third line is usually an indicator that prices are headed lower. As a result, the breaking of the third line constitutes a new downtrend line. The important point to remember here is that the breaking of the third trendline is the valid trend reversal signal.
